Two hydrogen atoms meet.
One says, ‘I’ve lost my electron.’
The other says ‘Are you sure?’
The first replies, ‘Yes, I’m positive.’

Two hydrogen atoms meet.
One says, ‘I’ve lost my electron.’
The other says ‘Are you sure?’
The first replies, ‘Yes, I’m positive.’


This is my presentation for NARCON 2010 (was NEMROC 2008 … see below), summarizing my efforts over the last three years since 2006 toward building a model rocket that won’t get lost.
The idea is that it carries a GPS and a steerable parachute, so it steers itself back to the launch pad on the way down.
An introduction to the project is in the PowerPoint presentation below. Fair warning: It’s 60 Mbytes.
Update January 2010: I’ve posted all the hardware design and source code for the “Rev 3” hardware on this site. The main index to the series of posts is here.
Update March 2010: I’ve replaced the presentation with a slightly updated version that I presented at NARCON 2010. It discusses a little about the “Rev 4” hardware, based on the 32-bit PIC32 MCU, toward the end. Download all 3 files (and put them in the same folder) if you want the Google Earth links to work.
2010-03 NARCON Presentation.ppt (PowerPoint file)
1004_f2_pressure.kml (Google Earth .KML file, flight of 2008-10-04)
1101f2_pressure.kml (Google Earth .KML file, flight of 2008-11-01)
If PowerPoint is an issue, here’s a PDF version of the slides (15 MB):
I’ve been working on the routine that converts my logged GPS and altimeter data into Google Earth .KML files.
It’s a lot nicer looking now – below is the same flight I posted on July 19 2008, but re-converted with the new routine.

New, improved Google Earth snapshot
Black marks pre-flight data, green marks ascent, yellow marks apogee (actually 1.5 seconds of data starting with apogee) and red marks descent. The lighter “whitish” marks are the GPS fixes, in this case 1.0 seconds apart. All the data in between is from the altimeter (25 Hz samples), with interpolated lat/lon position.
Here’s the .KML file – it’s fun to load it into Google Earth and fly around the track.
You can see where the rocket electronics detected launch (where black turns to green) and where it detected apogee and ejected the parachute (where green turns to yellow) – the crazy below-the-ground data point is the overpressure (sensed by the altimeter) from the ejection charge.
Last, if you click on the pad icon, you’ll see all kinds of flight data, automatically calculated from the log by the new routine.
It’s rather ugly MATLAB/SCILAB code. Someday I’ll post the source code online (once I clean it up a bit). If you’re desperate, drop me a note and I’ll email it to you.
I’ve been trying to learn more about building techniques for high power rockets (HPR). I’m already certified at Level 2, but I’ve still got a a lot to learn.
Here are a few web sites I’ve found to be particularly useful lately – maybe others will too:
Rocket Team Vatsaas: http://www.vatsaas.org/rtv/
A beautiful site with lots of construction tutorial info. I’m still working my way thru it. I haven’t met these guys, but I hope to one day.
Vern K’s site: http://vernk.com/
I met Vern at Black Rock in 2007 – his rockets are both beautiful and perform incredibly well. And, I stole the idea of making Google Earth plots from GPS/altimeter data from him (altho I think my plots are prettier). His site is a treasure trove of construction info and experience.
Robert DeHate’s site: http://www.geocities.com/rdh82000/
The site is kind of ugly, but there is lots of useful info in the “construction details” section of his projects. Robert’s huge rockets are the highlight of many launches. He’s meticulous about building reliable rockets – I need to be more like that. Robert also sells the world’s smallest altimeters; I have an AD4 model and it works great.
If you’re working with SMD stuff, it’s really helpful to have a 10 to 20 power stereo microscope (stereo, not “binocular” – it’s not the same thing) to see what you’re doing.
(The most common type is called a “dissection microscope” – try eBay; they can be had for < US$100.)
Here's something I made to help measure and identify SMD parts under the microscope - the SMD Pitch-o-meter:
[Update: See the new, improved version here.]

Print it out at 600 DPI (most any Canon or HP printer – I don’t know what will happen with an Epson printer – they do 720 DPI. It might scale it OK, might not.).
It has a scale of inches (to 1/250″) and millimeters (to 0.2mm) for measuring parts.
To measure SMD lead pitch (usually called parameter ‘e’ on datasheets) measure 4 (four) pins on the part from the line marked “zero”. Then read up for the pitch.
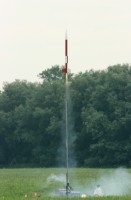
Here’s another set of in-flight photos from the SuperHorizion rocket, with the same e-sled used in Amesbury MA the previous week.
Here’s the launch – this time on a Skyripper H124PVC hybrid motor.

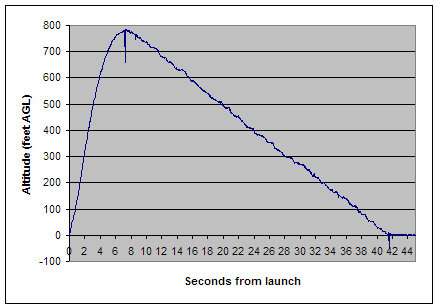
Flight data (from log in PIC):
Ejection altitude 780 feet AGL.
Ejection at 7.2 seconds.
Average ascent speed 74.2 mph.
Average descent speed 15.3 mph.
Descent time (estimated) 34.8 seconds.
Total flight time (est) 42.0 seconds.
Here’s the altimeter altitude graph – you can see the pressure spikes from ejection and landing.
I finally had some success taking in-flight photos from my SuperHorizon rocket on July 19. Here’s the rocket in flight:

SuperHorizon, on Aerotech H210T
Below are the images it collected in flight.
Click on any image for full-size version, including EXIF data. Warning: files are big.

Last pre-flight image

First image - ascending. Blurring is from motion.

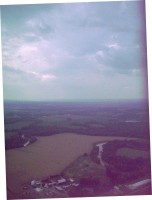
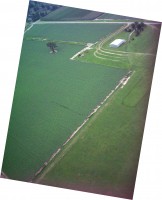
Looking straight down over the infamous powerlines. Somewhere close to apogee.

More power lines.

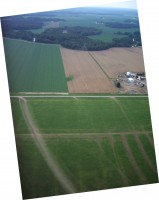
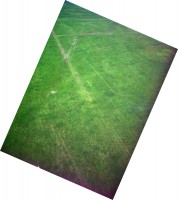
Farm equipment. This was one of several severely underexposed images that had to be "saved" in Photoshop. I'm not sure why this happens - maybe when the camera swings toward the sun it gets confused?

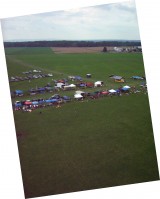
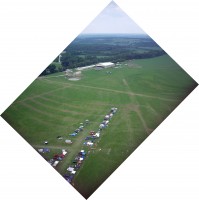
Best image of the flight - rotated and cropped a little, that's all. I can see my car in the parking lot, and kids on the soccer field. (Click to see full-rez image.)

Nice sharp image of the houses on the hill.

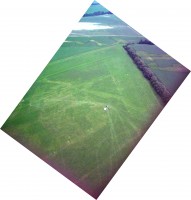
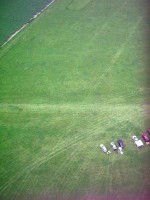
Coming down. Landing site is next to the truck.

Last flight image.
Below you can see the electronics sled with the Pentax Optio S6 camera that took the images. The shutter is triggered via IR from the PIC – the thing taped onto the camera is an IR LED. (I buy digicams on eBay with “broken screens” – they’re cheap but they still take pictures.)

Front view of camera. E-sled is actually upside down - camera goes toward nose cone.

Side view - shows mounting arragment for camera (note 1/4"-20 screw into tripod mount). The PIC (18LF2620) and GPS are on the other side of the sled.
Finally, here’s a .KML file of the flight for Google Earth: sh_july19
Download that and double-click it, and you’ll see a 3D plot of the flight – something like this:

Google Earth snapshot