Interim Report: GPS-guided Rocket Recovery

Saturn Zero

or,

Nevada Dave and the Rocket-Eating Trees

This is my presentation for NARCON 2010 (was NEMROC 2008 … see below), summarizing my efforts over the last three years since 2006 toward building a model rocket that won’t get lost.

The idea is that it carries a GPS and a steerable parachute, so it steers itself back to the launch pad on the way down.

An introduction to the project is in the PowerPoint presentation below.  Fair warning: It’s 60 Mbytes.

Update January 2010: I’ve posted all the hardware design and source code for the “Rev 3” hardware on this site.   The main index to the series of posts is here.

Update March 2010: I’ve replaced the presentation with a slightly updated version that I presented at NARCON 2010.  It discusses a little about the “Rev 4” hardware, based on the 32-bit PIC32 MCU, toward the end. Download all 3 files (and put them in the same folder) if you want the Google Earth links to work.

2010-03 NARCON Presentation.ppt (PowerPoint file)

1004_f2_pressure.kml (Google Earth .KML file, flight of 2008-10-04)

1101f2_pressure.kml (Google Earth .KML file, flight of 2008-11-01)

If PowerPoint is an issue, here’s a PDF version of the slides (15 MB):

2010-03 NARCON Presentation.pdf (PDF)

New, improved rocket tracks in Google Earth

I’ve been working on the routine that converts my logged GPS and altimeter data into Google Earth .KML files.

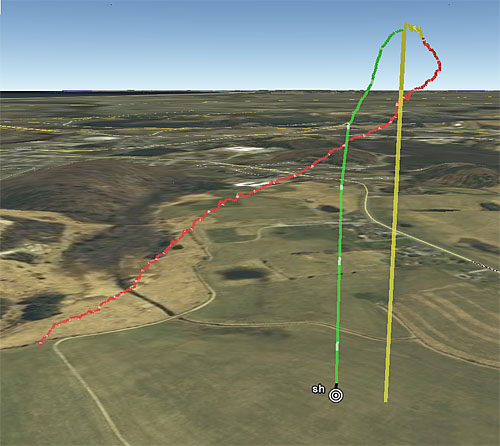
It’s a lot nicer looking now – below is the same flight I posted on July 19 2008, but re-converted with the new routine.

New, improved Google Earth snapshot

New, improved Google Earth snapshot

Black marks pre-flight data, green marks ascent, yellow marks apogee (actually 1.5 seconds of data starting with apogee) and red marks descent.  The lighter “whitish” marks are the GPS fixes, in this case 1.0 seconds apart.  All the data in between is from the altimeter (25 Hz samples), with interpolated lat/lon position.

Here’s the .KML file – it’s fun to load it into Google Earth and fly around the track.

You can see where the rocket electronics detected launch (where black turns to green) and where it detected apogee and ejected the parachute (where green turns to yellow) – the crazy below-the-ground data point is the overpressure (sensed by the altimeter) from the ejection charge.

Last, if you click on the pad icon, you’ll see all kinds of flight data, automatically calculated from the log by the new routine.

It’s rather ugly MATLAB/SCILAB code.  Someday I’ll post the source code online (once I clean it up a bit).  If you’re desperate, drop me a note and I’ll email it to you.